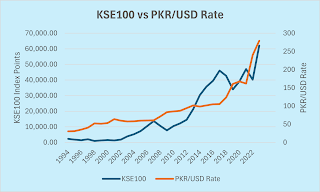
The Pakistani stock market is known to follow a well-established market cycle trend. It booms for a few years and then retreats or stagnates for a few more. Rinse and repeat ad infinitum. As covered in a previous blog, macroeconomic fundamentals are the key trigger for this behaviour; some of which include oil prices and the PKR/USD rate, or rather the stability of the rate.
Over the long run, the stock market should appreciate to provide a positive real return in dollar terms (theoretically, at least). The graph below plots out the KSE100’s dollar market cap over time along with the 5-year moving average. Since the 5-year moving average is a backward-looking lag variable, it tends to be sticky and trails the market cap.
Based on the graph, one can quickly notice two periods of 1997-2002 and 2009-2012 where the 5-year moving average faced a slump. Shortly after, the dollar market cap of the KSE100 index picks up. Note, the 5-year moving average lags the improvement in market cap by roughly a year.
Now from 2018-2023, the 5-year moving average faced a similar slump. But note, 2023 saw the KSE100 appreciate 24% in dollar terms. Hence, the five-year moving average is likely to pick up from next year.
Once the five-year moving average picks up, it remains on the uptrend for about six to seven years. Once again, the lagged nature of the variable means it lags the start and end of the rise of the KSE100 dollar market cap by a year. What does this mean? The market is looking very tasty for the next three to four years both in PKR and USD terms.
Interestingly, in each uptrend cycle, the previous dollar market cap high is broken. With the current market capitalization of KSE100 standing at $34 bn, breaking 2017's high of $91 bn would imply a 167% return (in $ terms). Note, the all-time high KSE100 dollar market cap is actually $99 bn.
However, this might be improbable given the steepness and depth of the preceding market decline since 2018 as well as the massive overvaluation of the rupee in 2017. Nonetheless, the stock market should yield solid returns over the next few years.
Based on this, the KSE100's Market Cap as a % of GDP has been far below its long-run average over the past few years once again highlighting the cheapness of the market at present terms. Once the market enters the boom phase of the cycle, the Buffett Indicator tends to remain above the average for roughly four years.
The two graphs above display the relationship between the KSE100 index and brent crude price as well as the PKR/USD parity.
With the PKR/USD parity, we observe that when the rupee is stable, the KSE100 tends to perform well. This can be rationalized by the fact that when the Pakistani rupee is stable, investors are confident that the value of their investment will be sheltered. This is of great importance to foreign investors which is why foreign portfolio investment rises during periods of PKR stability. But local investors also shift their capital to rupee-denominated assets like Pakistani stocks during such periods as dollar-denominated assets become less attractive in rupee terms.
At the same time, it is seen that the KSE100 tends to fully reflect and adjust for PKR depreciation. In fact, the graph shows that KSE100 far outperforms holding the USD. Since the inception of the KSE100 index, the index has provided a cumulative return of 2666% versus the dollar’s cumulative return of 813%.
As for oil prices, the KSE100 index tends to perform well when brent crude prices are falling or stable. The 2010s were notable as brent crude prices crashed but the KSE100 index soared with that result. The transmission channel here is that lower brent crude prices improves Pakistan’s current account which lowers pressure on its foreign reserves, thus helping the country avoid (or at least delay) a balance of payment crisis. This in turn relieves speculative pressure on the PKR/USD rate.
However, KSE100 can perform well even in the face of rising brent crude prices as the 2000s showed. However, the prolonged period of rising crude oil prices eventually did push Pakistan into a balance of payment crisis in 2008-09. So, in general, falling brent crude prices are favourable.
However, oil price changes are a major contributor to price level changes so over the long run, the KSE100 index tends to show a positive relationship with brent crude prices. This is because the index will and does adjust to reflect price level changes over the long run.
What does all this mean? The Pakistani stock market is a great buy at the moment despite the spectacular rise it saw last year. The uptrend phase of the market cycle has just begun, and Pakistan’s macros look good. The key question would be: when should one exit? The good news is you probably have a few years to contemplate that question.


No comments:
Post a Comment