SCBPL: Cheapest Bank There Is?

Over the past few months, the banking sector has seen significant buying momentum. Of course, the banking sector is not alone in this as the pharmaceutical, fertilizer and oil & gas exploration sectors have also seen a notable re-rating. However, what makes the banking sector special is that it possesses the highest weight in the KSE100 index – comprising 25.85% of the index. Moreover, there are 15 banks included in the KSE100 index making it the most represented sector in the index.

As a result, it should come as no surprise that the index is up over 16% since the start of November and up nearly 35% since the start of September. Over that same time frame, the BKTI (an index representative of the banking sector) is up over 16% and 31%, respectively.

Of all the banks listed in the KSE100 index, only three banks have not been a party to this rally – Meezan Bank (MEBL), Faysal Bank (FABL) and Standard Chartered (SCBPL). FABL is down 5% since the start of September and November, while MEBL is down 1% and up 1% (respectively) over the same time frame. Their underperformance is understandable given that the SBP imposed a minimum deposit rate on Islamic deposits last month.


However, SCBPL is down 13% and 8% (respectively) since the start of September and November. And for no apparent reason. The only fundamental news which could’ve impacted its share price was the Q3 earnings which came in lower by 12.5% QoQ. Yet, this is not isolated to SCB as other banks reported similar earnings with HBL a 13% drop in profit QoQ too for Q3. And HBL’s share price has rallied 38% and 33% since September and November.

It can also be said that SCBPL missed a Q3 dividend but so what? Many companies have missed a dividend, and the market bats an eye for a while but then sees value and bids the share price up. A key example would be Airlink which skipped a dividend for Q3, but its share price has continued its ride upwards.

On a relative basis, SCBPL would be most comparable to MCB and UBL given the similar risk profile (low risk), growth rates, high dividend yield and high payout ratio of the three banks.


In the three graphs above, we see that there has been a divergence between UBL and MCB+SCBPL in the PE ratio and share price since September. In terms of dividend yield, SCB trades at a higher yield of 16% versus 13% for UBL and MCB.

Based upon this, it could be argued that UBL is expensive, however UBL has rallied very much in line with the broader banking sector and market. If anything, MCB and SCBPL would appear to be undervalued. Given SCBPL’s higher yield and its lacklustre price performance since September, it would make for a stronger investment case.

Naturally, when one finds such a case of undervaluation, you have to wonder: how did the share get to this place? And then one wonders: what will be the trigger to cause value realization? To answer the former question, SCBPL is relatively small bank in terms of deposits and assets, so it goes under the radar. In fact, it has a beta of 0.55 highlighting it tends to not be heavily correlated with the index and the need for triggers to realize value.

As for the latter question, the upcoming Q4 earnings season could be the important trigger which causes a re-rating of SCBPL especially since it skipped a dividend for Q3. Expectations of a higher year-end dividend could drive up SCBPL’s share price. Plus, the market might take notice anyways since the banking sector has received key attention. So much so that even smaller banks like Soneri Bank have rode the wave of optimism recently.

Furthermore, there have been rumours that SCBPL’s downsizing of traditional banking network (bank branches) is indicative that it is preparing for a delisting or exit from Pakistan. If these rumours re-appear, they could act as a strong trigger for value realization.

Finally, a key concern that investors have when analyzing SCBPL is that it trades at a relatively high price-to-book ratio. Yet, this is a non-concern because a high price-to-book ratio is a function of a higher ROE. This blog has discussed this linear relationship between P/B ratio and ROE previously. Consequently, SCBPL’s relatively high P/B ratio is well-justified.

A high-quality bank such as SCBPL probably shouldn’t trade this way (sideways). At least, historically it hasn’t for too long.

July-Aug Investment Thesis

SBP announced that it will hold its first monetary policy meeting for the second half of the year on the 29th of July. The market, in expectation of that meeting, will begin to price in rate cuts and once the rate cut (expected 150 bps cut) occurs, dividend-yielding stocks will rally due to yield compression.

Post SBP’s June 2023 monetary policy meeting where a 150-bps rate cut was announced, high dividend-yielding stocks – particularly banking stocks – rallied. One can refer to the BKTI index for a clear visualization of this.

UBL, BAFL and MCB gave returns in excess of 25% within a few days of the meeting. A clear trend was observed between the secondary market for bonds and the stock market. Bond yields fell sharply but the stock market priced in the yield compression with a considerable lag. This lag might be shorter this time around as there is greater confidence regarding the possibility of a solid rate cut given that SBP has already begun the rate cutting cycle.


As the above shows, bond yields fell sharply over the last week hinting that yield compression might be in play in the stock market very soon. High-yielding banks should be an investor’s go-to in this scenario. The stock market has shown a tendency to price in yield compression first followed the pricing in of growth following it. The recent rally in the EV-related stocks (auto assemblers and battery manufacturers) depicts this could adequately.

Pakistan's Debt Dynamics: Less External Debt, Please!

Every once in a while, an ‘expert’ will expound their belief in various news media that Pakistan’s debt, especially domestic debt, should be restructured. What’s the key evidence or theory backing their arguments? Nominal figures stating the government could save an X billion amount of dollars in debt servicing.

These flimsy arguments are comical, to say the least. Another frequently cited statistic is that each 100-bps cut in interest rates saves the Pakistani government an estimated Rs 250bn. The interpretation of these figures totally misses the mark and primarily suffer from money illusion. Debt and its servicing costs cannot and should not be seen in nominal terms, alone.

Firstly, debt only has to be restructured when the borrower is unable to fulfil its financial obligations. When a borrower faces difficulty in making debt payments, creditors give concessions entailing a change in the payment terms (reduction in interest rate or extension of maturity) or a write-down (partial waive off) on the principal. This is done to avoid a costly bankruptcy case in the event of a default.

When it comes to domestic debt, the government is not close to this scenario at all as the SBP provides adequate liquidity to meet the government’s borrowing needs. Moreover, commercial banks are happy to continue funding government borrowing.

The need for domestic debt restructuring only arises if banks (or other financial institutions) decide not to fund government borrowing which could only happen due to a crisis of confidence. Historically, there has never been domestic debt restructuring which is why that crisis of confidence has not arrived.

However, hypothetically, if the government were to restructure domestic debt today, a crisis of confidence could arise in a future high debt-to-GDP ratio scenario. Which is why talks of domestic debt restructuring must not be taken lightly.

But what about the factor that really matters? Debt dynamics of domestic and external debt work differently for several reasons.

The above equation shows the domestic debt dynamics. The change in domestic debt-to-GDP ratio depends on a few key variables – real interest rate, growth rate, and primary balance. If r > g, debt-to-GDP escalates. Meanwhile, if the primary balance is negative (i.e. a primary deficit), then the debt-to-GDP worsens too.

Historically, real interest rates have averaged out around 0.1%-2.7% (depending on the choice of time period), while long-run growth rate of the economy has been 4.7%. So, in Pakistan, g > r by far which is positive for domestic debt dynamics. Implicit in this is the fact that the government has deflated its domestic debt over time – r has been low due to high inflation and central bank non-independence. Meanwhile, primary balance has been -0.5% of GDP since 1992 – which is not a good thing (IMF).

However, when you run these figures together in the equation, the total impact on domestic debt-to-GDP ratio has been negative – meaning domestic debt is sustainable or falling (in real terms).

Among this, there is an assumption that government revenues grow at the rate of nominal growth rate of the economy. Even that assumption mostly holds as nominal growth rate has been 13% while tax revenues have grown 12% over the past decade, for instance.

When it comes to external debt, the situation becomes murkier. To pay off external debt, the government does not only require tax revenue but adequate foreign reserves. Moreover, exchange rate shocks can escalate external debt payments (in local currency terms).

In the above equation which shows external debt dynamics, pcb stands for primary current account balance, while △res stands for change in reserves. In Pakistan’s case, interest rate on foreign debt r* has been 3.6% historically – much higher than that on domestic debt. Furthermore, the particularly troubling part is that this is only brought down due to concessional multi or bilateral lending.

The interest rate on commercial borrowing and bonds are usually 5% or above even in supposedly good times. Moving on, primary current account balance has been -1.9% of GDP since 1980. Even if you take out the effect of change in reserves (which is likely negative), the impact on external debt-to-GDP turns out to be positive – meaning external debt is rising in real terms or unsustainable.

This is some simple arithmetic which tell the true story of Pakistan’s debt dynamics. This is why when the Pakistani government restructured its debt in the 1970s and early 2000s, only external debt was restructured and not domestic debt. The math and some history speak for itself.

Cement Cos: Who is Best Poised to Benefit from Rate Cuts?

Cyclicals on the PSX have been on a serious bull run this year. Certain sectors such as the auto and fertilizer sectors have been on fire. Why? Well, expectations of an interest rate cut are leading to the belief that demand in the economy will pick up. Cyclicals would be a natural beneficiary.

The cement sector is another cyclical sector which has been at the forefront of this rally. With capacity utilization expected to be at 57% for FY24 and more capacity coming online over the next year, cement companies could see significant growth if demand does rebound.

But which cement companies would be best suited to exploit this opportunity? Or which ones could outperform the pack?

The important thing to note about cement is that the product is quite identical in quality, regardless of the producer. Moreover, the price of cement varies only based on the location of each producer (transaction cost). So, the differentiation in cement producers comes down to the production cost of each producer and their capital structure (debt-equity mix).

As a consequence, the key determinant of a cement company’s market value should be their production capacity.

If the market is valuing the production capacity of one producer more than another, it may be due to certain idiosyncratic characteristics. For instance, Bestway Cement has better governance practices than its competitors, so it naturally trades at a premium. But on average, companies with a lower market cap per ton of production capacity should be seen as cheaper on a fundamental basis.

Similarly, those with a lower PEG than the average should be seen as attractive as an investor is able to purchase growth at a lower per unit price. For the same reasons, a lower-than-average price-to-book value and EV per EBITDA would be attractive. However, a lower EV per EBITDA is special for another reason too.

Enterprise value is simply the total value of the firm’s debt and equity. Once interest rates fall, value would be transferred from debtholders to equity owners as finance costs for a company would fall. Or in other words, income flow to debtholders would fall.

Thus, a lower EV per EBITDA implies that the market is pricing each rupee of enterprise value for each rupee of earnings at a low rate. When interest rates fall, that enterprise value would become more valuable for shareholders.

On the flip side, a better-than-average return on equity and assets would be preferred as it implies more efficient capital allocation.

These metrics have been calculated here for the cement sector. Based on these metrics, Maple Leaf Cement looks the cheapest. Other seemingly cheap companies appear to be Fauji, Attock, Cherat and Kohat Cement.

Lucky Cement also seems to look cheap, however one cannot treat it as a true cement company due to its diversified (conglomerate) nature.

Based on these calculations, personally I prefer Maple Leaf, Attock and Fauji Cement among these fundamentally cheap companies, as they have a lower-than-average market cap per ton of production capacity.

An alternative viewpoint could also be to consider debt-to-equity ratios and pick those companies with the highest debt-to-equity ratios. Why? Well, when interest rates fall, finance costs (interest expenses) for such companies would plummet allowing them to enhance their earnings.

However, I personally do not subscribe to this view as it seems to take on unnecessary risk. One must note that the cement companies with the highest debt-to-equity ratios are those who are loss-making. What does this say about the management of these firms? Plus, why take on needless interest rate risk?

Furthermore, EV per EBITDA as a metric already captures the element of falling interest rates buttressing the financial viability of a firm.

So, based on this, when can one expect some of these cement shares to catapult themselves to new heights? Well, that’s the catch; one needs to be patient. It was only last week that Gharibal Cement (GWLC) was looking most cheap on these metrics.

Yet, within a week the share price of the company has gone up 37%. Now suddenly, the company looks realistically priced on a relative basis. That’s the thing about markets. They ignore value for some time. And when they do notice value on the table, they do so with aggression.  

Why OMOs Don’t Always Cause Inflation

Many commentators have been touting the monetarist belief that increased money supply through SBP’s Open Market Operations (OMOs) will continue to stoke inflation. It’s a belief I’ve held too but it is not true as circumstances have changed.

Money supply has been rising steadily over the years with an uptick since 2021. Monetarists would tell you this has been the true cause of inflation in Pakistan while quoting Milton Friedman: “Inflation is always and everywhere a monetary phenomenon”. 

(Source: State Bank of Pakistan)

This belief stems from the fundamental monetarist equation MV=PY (where M stands for Money Supply, V for Velocity of Money, P for Price Level and Y for Real GDP). A monetarist will tell you that if you hold V and Y constant, the only cause of inflation would be money supply growth. Thus, curtailing money supply would curtail inflation. Meaning, money supply growth and inflation (price level growth) follow a one-to-one relationship.

Generally, this has been true as money supply (M2) growth has largely tracked inflation in Pakistan. However, there has been a differential between the two much of the time. This is because the monetarist assumption of Y (and V) being constant does not always hold. 

(Source: IMF) 

For instance, most of the 2000s and early 2010s were a period of positive supply shocks marked by low commodity prices, thus helping generate lower inflation than as predicted by M2 growth. But this can work in the opposite direction too as the severe import restrictions and commodity price shocks in 2008-2009 and 2022-2023 led to inflation spiking beyond M2 growth. 

Nonetheless, a general trend between money supply growth and inflation can be inferred. So even if we take the monetarist belief as the rule and these slight divergences as the exception, how does SBP create money? 

For one, SBP can circulate more notes and coins to increase money supply. This is generally done to meet demand for money. A standard example is that during Ramadan/Eid, money demand spikes so the SBP caters to this demand in order to keep interest rates the same. And also, to not curtail real activity in the economy. After all, money is there to facilitate real transactions.

But the more sophisticated approach to creating money involves open market operations. Outright open market operations generally entail the SBP buying or selling bonds to vary money supply. Generally-speaking, when SBP buys bonds, the money supply goes up as the public has more cash while SBP selling bonds does the reverse. Note, broad money supply is defined generally defined as currency in circulation plus short-term deposits (current and savings account for instance). 
 
The transaction involves SBP buying bonds from financial institutions and crediting the accounts of those institutions. Now, ideally banks would use that credit to lend it out to borrowers as they do under normal circumstances. Those borrowers would keep their loans in the bank (as deposits), thus creating money and having an impact on the real economy. Note, in this process, it is the banks that are actually creating money through their choice to lend or not although SBP began the initial process of credit. 

However, when economic conditions worsen, banks generally tend to lend to the government or simply hold excess reserves. So greater credit (monetary base) does not translate to greater money supply. Hence, understanding how government borrowing is facilitated and how that money is spent can help unravel inflationary trends. 

When the government is short of cash, SBP performs what is known as reverse repos (another kind of OMO). In a reverse repo, SBP will buy T-bills or PIBs from banks with the agreement to purchase it at a higher price at a future date. The difference between the future purchase price and current sale price is determined by the interest rate. Meanwhile, the future purchase date depends on the tenor set by the SBP which usually ranges from 7 to 28 days. 

Now, when the government needs cash, SBP will perform these reverse repos so that banks have more cash. So, when the SBP holds auctions for government securities (to raise cash for the government), the banks will fund it with the cash received from the reverse repo. This is the great monetary settlement between the SBP, the government and the commercial banks.

But hang on a second, how does this cause inflation or affect the real economy? Well, when the government receives that money from the auctions, it chooses to spend it on goods and services. So, let’s say the government buys wheat from flour mills for a new subsidy program. The flour mills receive that cash and choose to spend a portion of it (or hold a portion as deposits). That spending leads to an income for someone else and this cycle continues ad infinitum. 

This is precisely how SBP’s reverse repos lead to inflation. But implicit in this example is that the government is spending that cash on goods which affects the real economy. As in, it is running a primary deficit which it generally has for most recent years.

However, this financial year, the government is actually running a primary surplus. Meaning, it is not really spending that reserve repo cash on goods. So where is that cash going? Well, it’s not really going anywhere; it’s just being circled around.

Essentially, that cash is being spent on debt servicing. So, the SBP is still handing cash to the banks which are buying government securities at auctions and giving the government that cash but only to retire or service old debt. So really, the money is not being spent anywhere – not making its way into the real economy or increasing the number of deposits. 

In this scenario, OMOs really do not cause inflation. An interesting example or parallel in monetary history to this would be the German MEFO bills of the Nazi-era. 

During the Nazi-era, the German government needed a lot of cash to reinflate the economy. Naturally that would cause inflation, so Hjalmar Schadt (the German Central Bank President) introduced an ingenious security called MEFO bills.

MEFO bills were promissory notes that served as bills for payment by the German government to manufacturers. They were convertible to the German currency but a higher interest rate on them was offered to entice manufacturers to hold those notes. Meanwhile, the maturity on these notes would continually to be extended so as to avoid conversion of these notes to the currency – to avoid increasing money supply.

So, what’s the lesson here? Greater credit does not always mean greater money supply or inflation. Consequently, OMOs (credit creation) do not always cause inflation. At least, they are not causing inflation in the present circumstances. 

KSE100: The Market Cycle and the Macros

The Pakistani stock market is known to follow a well-established market cycle trend. It booms for a few years and then retreats or stagnates for a few more. Rinse and repeat ad infinitum. As covered in a previous blog, macroeconomic fundamentals are the key trigger for this behaviour; some of which include oil prices and the PKR/USD rate, or rather the stability of the rate. 

Over the long run, the stock market should appreciate to provide a positive real return in dollar terms (theoretically, at least). The graph below plots out the KSE100’s dollar market cap over time along with the 5-year moving average. Since the 5-year moving average is a backward-looking lag variable, it tends to be sticky and trails the market cap. 

Based on the graph, one can quickly notice two periods of 1997-2002 and 2009-2012 where the 5-year moving average faced a slump. Shortly after, the dollar market cap of the KSE100 index picks up. Note, the 5-year moving average lags the improvement in market cap by roughly a year. 

Now from 2018-2023, the 5-year moving average faced a similar slump. But note, 2023 saw the KSE100 appreciate 24% in dollar terms. Hence, the five-year moving average is likely to pick up from next year. 

Once the five-year moving average picks up, it remains on the uptrend for about six to seven years. Once again, the lagged nature of the variable means it lags the start and end of the rise of the KSE100 dollar market cap by a year. What does this mean? The market is looking very tasty for the next three to four years both in PKR and USD terms.

Interestingly, in each uptrend cycle, the previous dollar market cap high is broken. With the current market capitalization of KSE100 standing at $34 bn, breaking 2017's high of $91 bn would imply a 167% return (in $ terms). Note, the all-time high KSE100 dollar market cap is actually $99 bn.

However, this might be improbable given the steepness and depth of the preceding market decline since 2018 as well as the massive overvaluation of the rupee in 2017. Nonetheless, the stock market should yield solid returns over the next few years.

Moving on, the graph above uses a metric known as the 'Buffett Indicator'. Named after Warren Buffett who used to tout its efficacy, the metric utilizes the fact that the stock market must reflect changes (growth) in the GDP, thus the indicator must be constant over time. 

Based on this, the KSE100's Market Cap as a % of GDP has been far below its long-run average over the past few years once again highlighting the cheapness of the market at present terms. Once the market enters the boom phase of the cycle, the Buffett Indicator tends to remain above the average for roughly four years. 


The two graphs above display the relationship between the KSE100 index and brent crude price as well as the PKR/USD parity. 

With the PKR/USD parity, we observe that when the rupee is stable, the KSE100 tends to perform well. This can be rationalized by the fact that when the Pakistani rupee is stable, investors are confident that the value of their investment will be sheltered. This is of great importance to foreign investors which is why foreign portfolio investment rises during periods of PKR stability. But local investors also shift their capital to rupee-denominated assets like Pakistani stocks during such periods as dollar-denominated assets become less attractive in rupee terms.

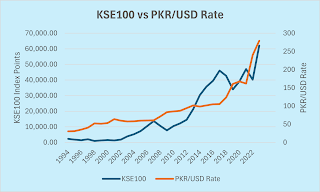
At the same time, it is seen that the KSE100 tends to fully reflect and adjust for PKR depreciation. In fact, the graph shows that KSE100 far outperforms holding the USD. Since the inception of the KSE100 index, the index has provided a cumulative return of 2666% versus the dollar’s cumulative return of 813%. 

As for oil prices, the KSE100 index tends to perform well when brent crude prices are falling or stable. The 2010s were notable as brent crude prices crashed but the KSE100 index soared with that result. The transmission channel here is that lower brent crude prices improves Pakistan’s current account which lowers pressure on its foreign reserves, thus helping the country avoid (or at least delay) a balance of payment crisis. This in turn relieves speculative pressure on the PKR/USD rate. 

However, KSE100 can perform well even in the face of rising brent crude prices as the 2000s showed. However, the prolonged period of rising crude oil prices eventually did push Pakistan into a balance of payment crisis in 2008-09. So, in general, falling brent crude prices are favourable. 

However, oil price changes are a major contributor to price level changes so over the long run, the KSE100 index tends to show a positive relationship with brent crude prices. This is because the index will and does adjust to reflect price level changes over the long run. 

What does all this mean? The Pakistani stock market is a great buy at the moment despite the spectacular rise it saw last year. The uptrend phase of the market cycle has just begun, and Pakistan’s macros look good. The key question would be: when should one exit? The good news is you probably have a few years to contemplate that question. 

Allocating across Asset Classes: Gold, USD or Stocks?

Over the past few years, a large segment of the Pakistani population has espoused the belief that the dollar is the best asset class in Pakistan. Traditional economic theory would differ from this belief as prices and exchange rates have a one-to-one relationship in the long run, thus holding the vehicle currency (dollar) over the long run provides no real return. But let’s take a deep dive into how gold, USD and stocks perform over time.

Firstly, Pakistani fixed income investments are being omitted from the analysis as they’ve barely provided a positive real return over the long run; inflation has averaged around 7.9% over the long run while interest rates have averaged around 8%. Moreover, real estate has been excluded due to lack of aggregative data on property prices. Zameen.com does have a property price index but it is limited in its time frame as well as geographical aggregation.


Historically, gold has been expounded as an inflation-neutralizing asset class. However, that statement applies when the comparison is made for developed nations. In Pakistan, it is generally an inflation-beating asset class. This is a result of gold being a dollar-denominated asset so not only does its return reflect depreciation/devaluation of PKR but also increase in the price of gold over time. The twofold source of return provides a nice cushion for a gold investor.

As for cross-comparison of asset classes versus inflation, it is observed that the USD has not beaten inflation over a long-time frame. Meanwhile, both the KSE100 index and gold have significantly outpaced inflation. Till the end of 2023, gold edged out the KSE100 index but the trajectory of both stocks and gold in Pakistan is fascinating, to say the least.

Interestingly, there have been time periods where the KSE100 index has outperformed gold but also a huge stretch of time where it has lagged behind gold. Much of this is down to the market cycles observed in stocks and real estate in Pakistan.

Based on these observations, an astute investor would not allocate any of their capital towards the USD as gold is a much better inflation hedge which already incorporates the return from holding the USD. But to take it one step further, allocation between gold and stocks should be tinkered with from time to time.

When the market cycle enters the growth phase, one should shift their allocation towards stocks as stocks tend to outperform gold during this phase. Meanwhile, when the market cycle returns to the stagnation phase, one must lean more towards gold in their allocation.

It is important to note that correlation between gold prices and the KSE100 is 0.68 suggesting a moderate positive relationship. Thus, reflecting the fact that both asset classes adjust to nominal inflation effectively over the long run.

My personal gripe with real estate in Pakistan is the lack of liquidity and the large amount of investment required to invest in real estate – which leads to overallocation of capital to real estate. Nonetheless, selective pockets of real estate in the major cities of Pakistan have been excellent investment opportunities. If one possesses information not available to the public, plenty of money can be made in real estate. But that means high barriers to entry so not something a regular investor can count on. Thus, the emphasis on gold and stocks remains.

Regardless of the viability of real estate as an asset class, this much is clear: holding the USD makes for a very poor investment. One should stick to a mix of gold and stocks. Gold can be a great inflation/depreciation hedge, while stocks can act as a good source of steady income (dividends) and inflation hedge over the long run.

KSE100: Where Will It Go From Here?

After returning 55% (24% in USD terms) in 2023, the KSE100 index has flatlined in the first quarter of 2024. Some commentators have begun questioning the foundation of the magnificent rally that occurred in the second half of 2023. However, this short-term view suffers from a lack of understanding (or ignorance) of market cycles.

A very well-acknowledged fact about the Pakistani stock market is that it is very sensitive to the ‘macros’. Macros being certain macroeconomic variables like interest rates, foreign reserves and the value of the PKR. This is in contrast with stock markets elsewhere in the world.

In most other nations, the growth rate of the economy (which determines earnings growth), equity risk premium and dividend payout ratio matter for stock market performance. This has its theoretical origins in the basic Gordon growth model. Thus, usually the market goes through boom-and-bust cycles primarily based on changes in equity risk premium or growth rate of the economy.

For these reasons, you frequently see global stock markets tanking when the economy goes into a recession or rising when speculation is rampant (equity risk premium falls) – dotcom bubble for instance. The key difference between these economies and Pakistan’s economy is structural.


Consumption as a % of GDP

In most other nations, the economy is well-diversified with growth being channelled through a mix of investment, consumption (imports) and exports. On the other hand, Pakistan’s growth model is heavily import and consumption reliant. This causes Pakistan to run into persistent balance of payment crises when growth heats up.

Consequently, there’s a counterintuitive trade-off between growth and creditworthiness (confidence) of (in) Pakistan which doesn’t typically exist in most other countries. This friction causes the Pakistani stock market to boom for four to five years followed by a period of stagnation for the next four to five years.

Generally, the market booms when the PKR is stable, interest rates are low/falling and foreign reserves are rising/stable – invoking confidence. These conditions trigger investors to realize the value of earnings which had been rising and accrued in the period of stagnation.  

From the trough to the peak, the PE ratio of the market varies from 3 to 12. Despite the persistence of these cycles, investors always get duped by pessimism during the period of stagnation and the optimism of a ‘new future’ during the growth phase.

This market cycle is not only observed in the stock market but also the real estate market in Pakistan. Real estate prices tend to double within a couple of years and then stagnate for four to five years. The last cycle was observed in the 2016-2021 period. From 2016 to early 2020, the real estate market stagnated and then catapulted itself to new heights from mid-2020 to 2021. Now, it has returned to the stagnation phase.

For the KSE100, the market cycle is much easier to observe through data. The above graph uses a metric called the ‘5-year annualized return’ to succinctly display when one should enter or exit.

When the 5-year annualized return shoots above 10% in a certain year, the market enters the growth phase and when it plummets below 20% in a certain year, it enters the stagnation phase. In 2024, the 5-year annualized return shot above 10% highlighting that the market may have entered the upswing cycle.

There are fundamental reasons to support this assertion. SBP foreign reserves have recovered from a low of $3.1bn in early 2023 to $8bn in March 2024. Interest rates are expected to begin their path downwards this year – possibly from April with inflation trending down. Lastly, the PKR has been relatively stable with expectations of sharp depreciation low. The balanced current account also eases pressure on foreign reserves and the PKR.

There is genuine cause to believe that the Pakistani stock market is in for a few good years. Whether those few good years turn into a good decade or two depends on whether structural reforms are implemented or not. But considering history, betting your money on that would be risky.

The better gamble would be to go long for the next 3-4 years. The rally of the second half of 2023 has shown that one cannot time the exact movements of the market but staying committed will reap rewards.

One cannot know when SBP will cut interest rates this year, but when it does a rush of money will flow away from fixed income and into other assets primarily riskier assets like stocks. This is an occasion where buy-and-hold is a solid strategy. At least for a few years, that is.

An Oddity in Real Estate: DHA Phase 10 Files


Following the 2020-21 boom, Pakistani real estate has stagnated. Some localities have witnessed a 10% correction while others have barely slugged along. None of this is surprising given that interest rates stand at 22%; investors presently prefer to keep their cash at the bank.

Liquidity has dried up too. DHA Lahore used to witness over 100 property transactions every day back in 2021. However, now that rate is down below 50 per day.

In the grander scheme of things, this is just part of the market cycle. Having been through the boom phase a couple of years ago, real estate is taking a backseat and is in its slump phase.

Generally speaking, there’s a four-to-five year gap between the peak of the boom and peak of the slump for the real estate sector. As per this rule of thumb, the current property market slump should begin wrapping up in 2025.

Within any real estate slump, the property files market is the first segment to see a sharp retreat. And this time around, the retreat has been even sharper.

As per Zameen.com’s price index, DHA Phase 10 has experienced a 3% fall in the past month. But one must note that Zameen.com’s index does not accurately track real estate prices. Due to stickiness of listing prices, the index lags true property prices by six to twelve months.

Instead, one can utilize online rate lists posted by real estate agents as an accurate reference of the files market. As per LahoreRealEstate’s Phase 10 residential files rate list, 5 marla trades at 32 lacs, 10 marla at 56 lac and one kanal at 99 lacs. This is in stark contrast with DHA Phase 10 residential file rates back in May 2023.

Back in May 2023, the rates were 45 lacs, 61 lacs and 108 lacs for 5 marla, 10 marla and one kanal respectively. At current prices that represents a 29%, 8% and 8% pullback in 5 marla, 10 marla and one kanal rates respectively.

These rates are consistent with rate lists posted by other real estate agents and websites such as dharealestate.pk. Consequently, there is no question about the veracity of these figures. Having read the above, a student of finance would tell you that this is a possible case of mispricing. They would recall a little concept they learned in class: the law of one price.

The law of one price states that the price of an identical asset should have the same price. In this case, the files will be balloted at the same time and the location of the land they possess a claim to is unknown. Consequently, if DHA Phase 10 files market sees a recession, then files of all sizes should see a similar downtrend. However, we witness a vast variation in price drop.

From the above rate lists, one would also notice another oddity: 5-marla files trade at a premium to one-kanal files on a per marla basis. However, this is standard in the real estate market as relatively developed areas such as the next-door neighbor DHA Phase 9 Prism has 5-marla plots trading at a premium to one-kanal plots in the same locality.

Roughly speaking, 5-marla plots trade at a third the value of one-kanal plots with the same characteristics. This is reasonable as demand for 5-marla housing is higher due to their relative affordability and there are fewer fees/taxes associated with them.

Returning to the previous oddity, 5-marla files in Phase 10 have seen greater volatility. This could be due to their higher trading volumes, which allows for greater price discovery. Or it could be a result of their lower base/price. However, this base effect would be beneficial for investors when the market picks up, as returns would get amplified.

If the Phase 10 files market takes an upswing, it’s likely that files of all sizes will touch their 2022 peaks. Assuming this, 5-marla, 10-marla and one-kanal files would give a 41%, 9% and 9% return, respectively.

5-marla would be the best option due to its potential upside. However, this potential upside can be a concern for greater volatility/risk in the short-term.

Before coronavirus hit the world, Pakistan’s property market was going through a terrible slump. At that time, 5-marla files in DHA Phase 10 were trading at a bottom of 25 lacs. If you were to assume this as a support level, then it gives a potential downside of 22% from current price levels.

On top of this, who knows when the DHA Phase 10 files market would pick up? There can be two significant positive triggers for DHA Phase 10 files market. One could be that the property market returns to its boom phase but that is possible 2-3 years away. Secondly, DHA could start Phase 10 balloting which would generate immense investor interest.

Balloting for a new phase takes place roughly every eight to ten years. DHA Phase 9 prism was the last phase to be balloted back in 2015. That would mean that DHA Phase 10 balloting should be expected by 2024-25. But DHA only does new balloting when the property market is in its boom phase. Therefore, the key pre-requisite for DHA Phase 10 files to give upside is when the property market pulls itself out of the present slump.

Nonetheless, if an investor is looking to enter the property files market, 5-marla files in DHA Phase 10 should be their go-to when the market picks up. Until then, they can continue to enjoy a cool 20% per annum return on their bank deposits.  

Banks Selling at a Discount: Debt Restructuring Fears

Beyond the glimmer of attractive dividend yields, there lies a dim reality for banks. The market still fears domestic debt restructuring is a very real possibility. Consequently, banks continue to trade at steep discounts.

After my last blog, a couple of people inquired: how can we quantify the ‘debt restructuring’ discount for banks? Before diving into this, one has to first provide a background of valuing banks.

Historically, banks had been valued using a basic dividend discount model which most or every finance/economics undergraduate would be familiar with. Often also called the ‘Gordon growth model’ (GGM). However, the 2008 financial crisis revealed the fragility of using GGM for valuing financial companies.

The main issue with GGM (for valuing banks) is that it provides or incorporates no information on the regulatory capital of a bank. A bank might be paying really high, regular dividends. However, if those dividends are backed by significantly risky investments, the bank might be left undercapitalized.

This is where an equity reinvestment model jumps in. In such a model, free cash flow is found by taking net income and netting out investment in regulatory capital (tier 1). Then to obtain net income, you work your way back. You can look at the chart below to understand this (made by Aswath Damodaran):

So, in this model, the key determinants for determining the value of a bank are cost of equity, growth rate (banking assets growth rate), return on equity and target tier 1 capital ratio.

Using this FCF model, you can predict the fair value of a bank. However, you can work your way back and find the implied target tier 1 capital ratio. Or what the market thinks a bank’s future tier 1 capital ratio would be.

 For the first three key determinants, we can use historical averages. Cost of equity currently stands at 28% (22% risk-free rate plus a historical 6% ERP), while long-run cost of equity would be 14% (8% historical average risk-free rate plus 6% ERP).

Similarly, banking asset growth rate has stood at 16% for the past five years but 10% in the long run. Lastly, ROE can be computed on a bank-to-bank basis. For instance, SCB’s 5-year average ROE is 25% which is heavily inflated due to windfall profits in CY23. Historically, banking sector ROE has been 18%.

Based on this, and SCB’s current Tier 1 capital ratio of 18%, the market is expecting that SCB’s tier 1 capital ratio (in perpetuity) would be 3%. That means a significant wipeout of capital which would push SCB’s CAR below SBP’s minimum requirement. This cements the view that the market is still pricing in a significant debt restructuring discount for banks.

The story is very similar for other premier and non-premier banks. So, if interest rates start coming down, that would actually bode well for banks. Why? Because every 100 BPS reduction in interest rates leads to a reduction in debt servicing costs of approximately Rs 250 bn for the government.

This would reduce the chances of federal debt restructuring as the government would obtain more fiscal space. Moreover, is such a steep discount justified for banks when domestic federal debt restructuring has never taken place in Pakistan? Even while external debt restructuring occurred, local/rupee-denominated debt was never restructured.

Markets have a tendency to underweight unlikely or tail events. However, this might be a case of the market overweighting a tail event – domestic debt restructuring. Perhaps, one should be overweight on banks?

Why I’m Bullish on Banks

Since 23rd June 2023, the KSE100 index has rallied 61%. On the other hand, the Banking Tradable Index (BKTI), which constitutes Pakistan’s major banks, has rallied 75%. And this is despite the fact that the KSE100 index is a total return index (incorporates both capital gains and dividends), while BKTI index is a price return index (only includes capital gains).

The banking sector is one of the few sectors which have outperformed the broader-market indices over the past year. And why wouldn’t it when it offers an attractive dividend yield? The average CY23 expected dividend yield for BKTI stands at 12.3%. If you swap out Bank of Punjab for Standard Chartered in the index, that number goes up to 15.6%.

That contextualizes a major reason behind the banking rally: yield compression. Simply-speaking, assets of similar risks must deliver similar yields. When the IMF announced the Staff Level Agreement in late June 2023, the risk associated with Pakistani assets went down, thus yields on stocks had to compress – especially those that pay high, regular dividends. Moreover, with expectations of interest rate cuts in 2024 rising and macros getting better, that risk continues to fall thus boosting asset prices.

But why does the banking sector trade at a dividend yield far beyond 10% when the market as a whole is trading below that cutoff now? The market might still be pricing in idiosyncratic risk associated with the banking sector. Aka the risk of (domestic) debt restructuring.

However, the chances of domestic debt restructuring might be far lower than the market expects. Why? Well, commercial banks have been simply doing what the Finance Ministry and SBP expects of them – acting as a chain between SBP and the government for lending.

Wiping out bank capital is not exactly a good reward for obeying such ‘indirect’ orders. It would permanently damage confidence in the domestic debt market and make it difficult for the government to reliably issue debt over the long run. Hence, no domestic federal debt restructuring has taken place in Pakistan’s history even as external debt has been restructured.

Moreover, it is not domestic debt which is unsustainable but rather external debt. Much of the government’s international borrowing took place at an interest rate of 6-9%. This is far higher than the long run growth rate of Pakistan at 4.8% (i > g here). If you further deconstruct the borrowing, the unsustainability of it becomes clear.

Borrowing externally at a rate of 6-9% and adding in natural long-run depreciation of 5-8% translates to a rupee cost of debt of 11-17%. Historically, rupee cost of local debt has been 8% in Pakistan.

And in fact, since 2022, when external financing conditions deteriorated, the government was forced to issue more domestic debt to replace maturing external debt. The graph on the right shows net external debt ($) of the government. One can notice the graph deviates from a natural trendline from 2022 – only showing a slight uptick towards the end of 2023.

As external financing conditions improve, the need to borrow from domestic markets will reduce, thus making local debt more sustainable.

What’s the best news among all this? Banks might actually be the biggest winners from falling interest rates. Sounds counterintuitive but it’s true. Yes, net interest margins would reduce slightly affecting profitability but falling interest rates would reduce the government’s debt servicing bill and give it some fiscal breathing room. That itself would largely alleviate the risk of debt restructuring, thus boosting asset prices. Interest rates being at 22% are not the norm but rather an anomaly (remember: historically, interest rates have averaged 8% in Pakistan).

Furthermore, falling interest rates would mean further yield compression as more investors rush to equities. There are still several banks which trade at attractive dividend yields – a couple offering even more than the risk-free rate.

So which banks would be good targets? Certainly, banks which offer a tasty dividend yield. They would benefit most from the yield compression and would act most as bond proxies which generally tend to rally in a falling interest rate environment. If you go back to 2021, banks like UBL and MCB were trading at a PE of 8 and at a dividend yield of 10-12%. 

Besides this, banks which could potentially increase payouts would unlock significant shareholder value. This is because excess cash sitting on the books would be returned to shareholders.

With banks like Standard Chartered and Bank Al-Habib doing just that over the past year, there would be pressure on other banks to follow suit given the massive increase in earnings as of recent.

MCB and Bank Alfalah (BAFL) could be potential banks increasing payouts. 5-year dividend payout ratio for BAFL and MCB stands at 53% and 80%, respectively. EPS for CY23 is expected to come in at Rs 23 per share and Rs 50 per share for BAFL and MCB, respectively. That leaves massive room for a large Q4 dividend if BAFL and MCB stick to their dividend payout ratio trend of the past five years.

The earnings season fever might be the trigger to unlock further value in banks. And it lurks just around the corner now…